

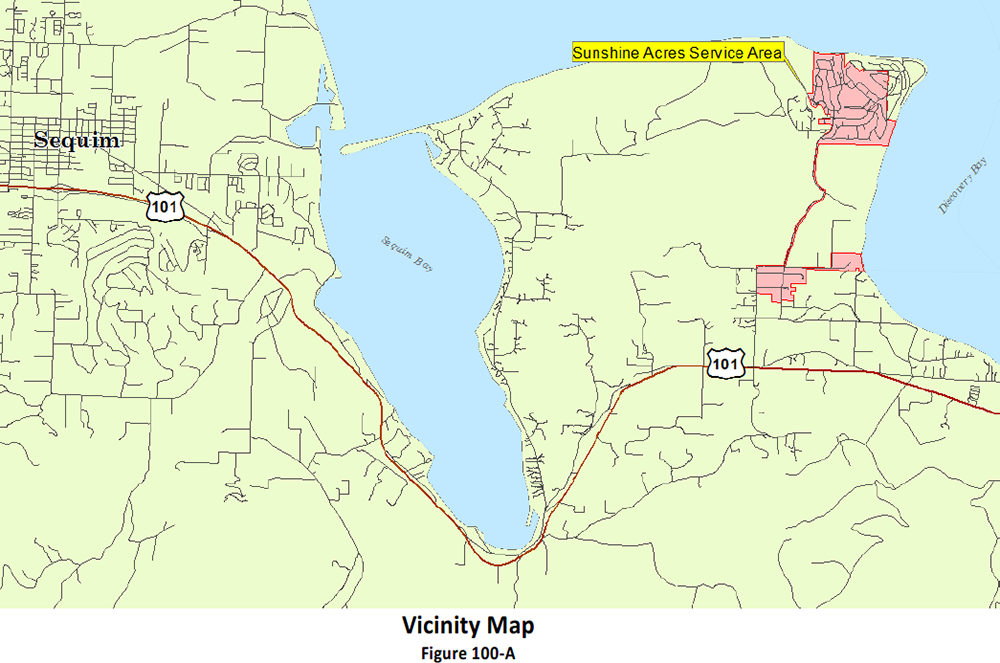
Sunshine Acres retail service area is shown on the attached map, the general vicinity is shown below:
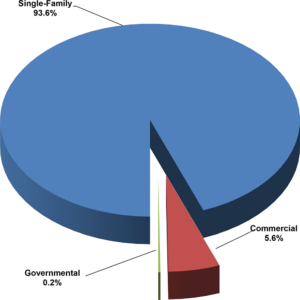
The breakdown of current connections served by Sunshine Acres per customer class is shown in Figure 200-A.
Distribution of Equivalent Residential Units (ERU)
Figure 200-A
Historical water use patterns are used for a variety of reasons including demand forecasting, planning for new source development, evaluating conservation measures, assist in making water resource decisions and many more.
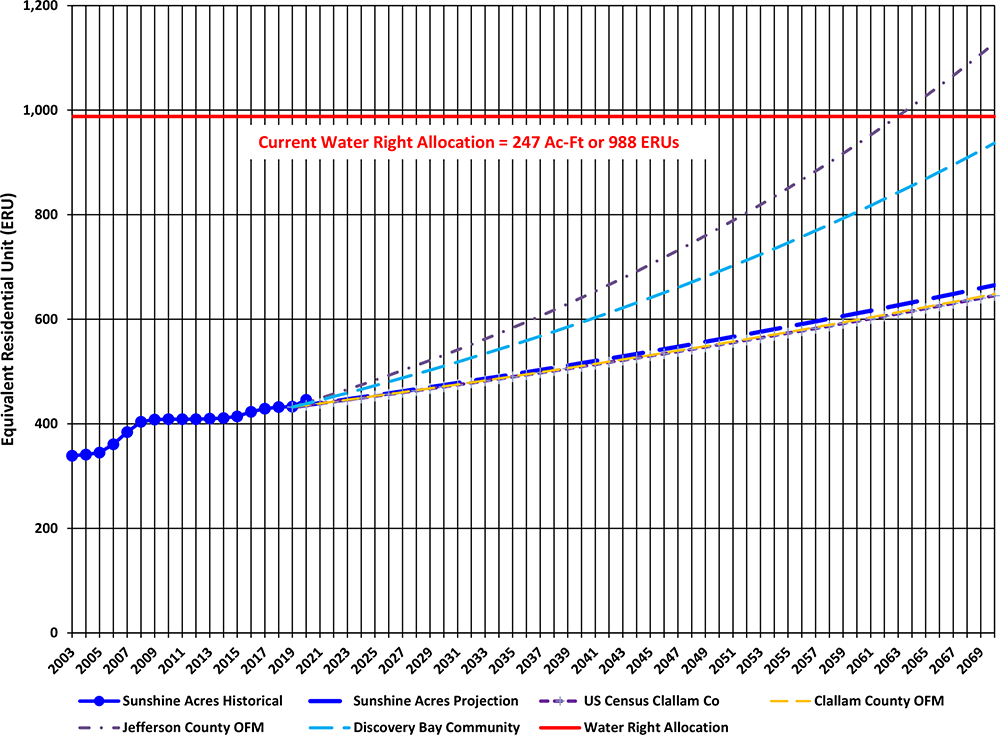
The system’s historical annual customer demand per customer class is demonstrated in Figure 200-C below, the Sunshine Acres annual demand has historically been well within its total Water Rights allocation.
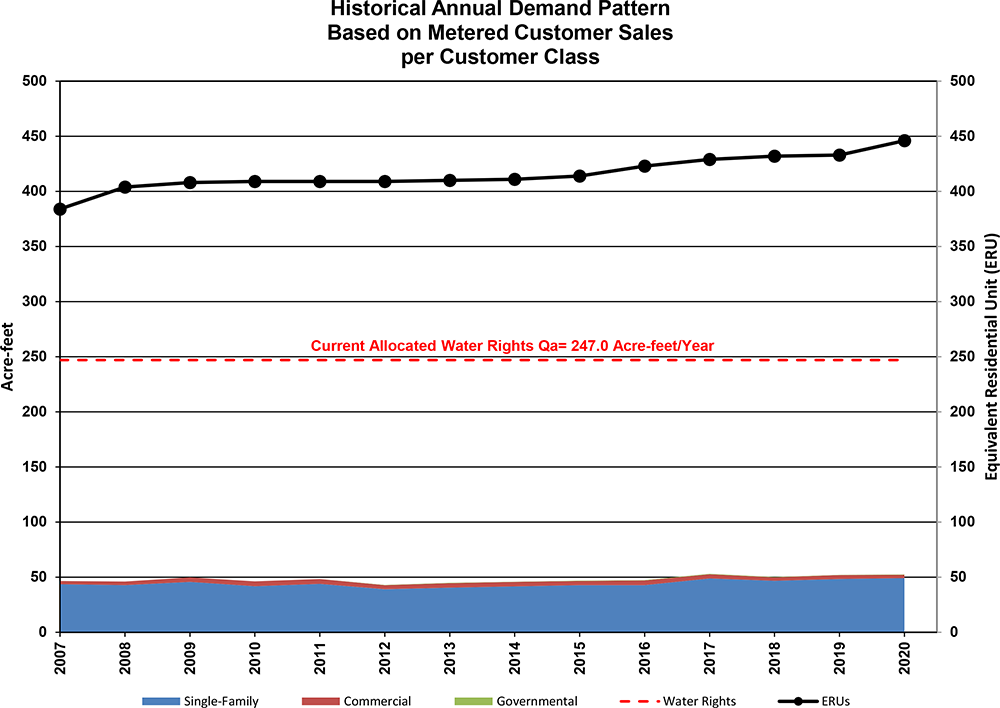
Figure 200-E below shows the seasonal demand pattern.
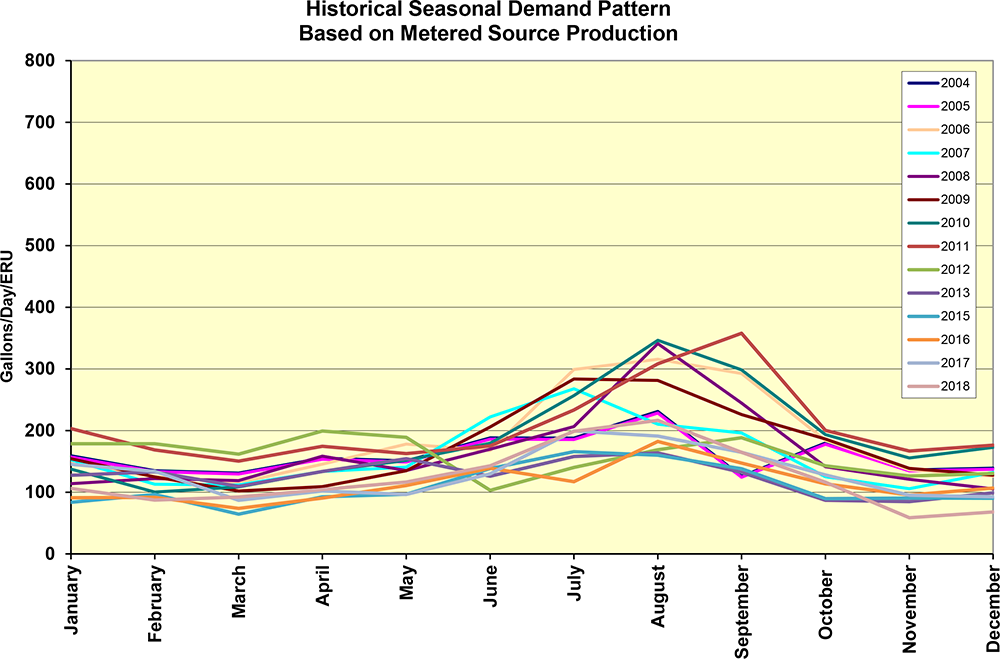
Table 200-05 documents the historical distribution system leakage for Sunshine Acres. All waters that cannot be accounted for are considered components of distribution leakage. Leakage is expressed as a percentage of the total annual volume produced. The goal is for Distribution System Leakage (DSL) to be less than 10%.
| Year | ERU’s | Metered Source Production, gal | Metered Customer Sales, gal | Identifiable System Losses, gal | DSL Gallons | DSL % | Running 3-Yr Average |
|---|---|---|---|---|---|---|---|
| 2004 | 341 | 22,930,896 | 14,596,128 | 8,334,768 | 36 | ||
| 2005 | 345 | 19,893,700 | 14,113,032 | 5,780,668 | 29 | ||
| 2006 | 361 | 24,514,940 | 15,467,668 | 50,000 | 8,997,272 | 37 | 34 |
| 2007 | 384 | 22,318,380 | 15,148,302 | 53,700 | 7,116,378 | 32 | 33 |
| 2008 | 404 | 24,302,220 | 16,207,573 | 103,700 | 7,990,947 | 33 | 34 |
| 2009 | 408 | 25,737,630 | 17,368,563 | 207,000 | 8,162,067 | 32 | 32 |
| 2010 | 409 | 27,789,850 | 18,209,754 | 100,470 | 9,479,626 | 34 | 33 |
| 2011 | 409 | 30,343,479 | 16,247,817 | 20,355 | 14,075,307 | 46 | 37 |
| 2012 | 409 | 23,722,137 | 15,778,684 | 41,695 | 7,901,757 | 33 | 38 |
| 2013 | 410 | 18,811,120 | 16,321,170 | 429,250 | 2,060,700 | 11 | 30 |
| 2014 | 411 | 16,325,376 | 16,569,725 | 26,830 | -271,179 | -2 | 14 |
| 2015 | 414 | 16,765,802 | 16,682,373 | 225,000 | -141,570 | -1 | 3 |
| 2016 | 423 | 17,479,870 | 16,916,947 | 53,813 | 509,110 | 3 | 0 |
| 2017 | 429 | 17,479,870 | 17,274,583 | 73,860 | 131,427 | 1 | 1 |
| 2018 | 432 | 17,479,870 | 16,856,008 | 18,092 | 605,770 | 4 | 2 |
Section 200.18 above documents Sunshine Acres’ historical growth rate over the pasted 10-years was 0.67% annually.
Most of the growth will be limited to in-filling of existing Lots of Record for single-family residential homes within the existing plats of Sunshine Acres.
There are three (3) undeveloped Lots in the Diamond Point Airport (DPA) zone that could be developed for commercial activities.
Sunshine Acres historical annual growth rate has ranged from 0.0% to 1.6% between the years 2003 through 2018. The past 10-years, 2008-2018, annual growth rate was 0.67%. The projected Sunshine Acres growth rate for the next planning period will be 0.85%. The projected number of ERU’s is shown in Table 200-10 and in Figure 200-F below.
Using the system’s growth projection and demand projection described above, Tables 200-12 and 200-13 below demonstrate the system’s forecasted demand for the next consecutive 10-years, the 20th -year and the 50th -year of projected growth.
Table 200-12: Source Base Forecasted Demand w/o Conservation
| Year | ERUs | ADD* (gpd) | MDD** (gpd) | PHD (gpm) |
|---|---|---|---|---|
| 2020 | 436 | 76,243 | 196,052 | 303 |
| 2021 | 439 | 76,891 | 197,719 | 305 |
| 2022 | 443 | 77,544 | 199,399 | 307 |
| 2023 | 447 | 78,203 | 201,094 | 309 |
| 2024 | 451 | 78,868 | 202,804 | 311 |
| 2025 | 455 | 79,538 | 204,527 | 313 |
| 2026 | 458 | 80,215 | 206,266 | 315 |
| 2027 | 462 | 80,896 | 208,019 | 318 |
| 2028 | 466 | 81,584 | 209,787 | 320 |
| 2029 | 470 | 82,277 | 211,571 | 322 |
| 2030 | 474 | 82,977 | 213,369 | 324 |
| 2040 | 516 | 90,306 | 232,215 | 347 |
| 2070 | 665 | 116,411 | 299,342 | 421 |
*Based on ADD using 175 gpd/ERU (see above)
**Based on MDD using 450 gpd/ERU (see above)
Table 200-13: Source Based Forecasted Demand w/ Conservation
| Year | ERUs | ADD* (gpd) | MDD** (gpd) | PHD (gpm) |
|---|---|---|---|---|
| 2020 | 436 | 65,350.80 | 185,161 | 287 |
| 2021 | 439 | 65,906.28 | 186,734 | 289 |
| 2022 | 443 | 66,466.49 | 188,322 | 291 |
| 2023 | 447 | 67,031.45 | 189,922 | 293 |
| 2024 | 451 | 67,601.22 | 191,537 | 295 |
| 2025 | 455 | 68,175.83 | 193,165 | 297 |
| 2026 | 458 | 68,755.32 | 194,807 | 299 |
| 2027 | 462 | 69,339.74 | 196,463 | 301 |
| 2028 | 466 | 69,929.13 | 198,133 | 303 |
| 2029 | 470 | 70,523.53 | 199,817 | 305 |
| 2030 | 474 | 71,122.98 | 201,515 | 307 |
| 2040 | 516 | 77,404.99 | 219,314 | 329 |
| 2070 | 665 | 99,780.58 | 282,712 | 399 |
*Based on ADD using 170 gpd/ERU (assumes a conservation savings of 5 gpd/ERU)
**Based on MDD using 445 gpd/ERU (assumes a MDD savings of 5 gpd/ERU)
Below are the improvement projects that have been identified for this water system.
Project Tracking, Projected Costs and Funding Source related to the company’s tracking methods for all Capital Improvement Projects are defined in the companywide Water System Plan Part A, Program C-2, “Operations Budget, Consolidated Financial Plan & Capital Improvement Program”.
Each Capital Improvement Project is assigned a “Project Priority” identifier. A list of these project priority definitions can be found in the companywide Part A Water System Plan, Section 800 and in Program Document C-2. Project priority identifiers are used in the annual budgeting and scheduling of the company’s Capital Improvements.
6 — Improvement Schedule
Sunshine Aces (SHA)
20 YEAR IMPROVEMENT PROGRAM
| SHA-25 | Timber Drive Loop Closure | 2019-2020 |
| SHA-26 | Rondelay Booster Station Demolition or Repair | 2021 |
| SHA-11 | Wellsite Auxiliary Power Upgrade | 2021 |
| SHA-39 | Install Storage Tank Sample Taps | 2022 |
| SHA-28 | Rondelay Well #1 Decommission | 2022 |
| SHA-27A | Rondelay Well #4 Replacement Well | 2022 |
| SHA-27 | Rondelay Well #4 Treatment for Mn Removal | 2022 |
| SHA-12 | Zone 2 BPS Auxiliary Power | 2022 |
| SHA-31 | Lower Tank Reader Board | 2023 |
| SHA-30 | Lower Tank Vent | 2023 |
| SHA-14 | Madrona Way Main Upsize | 2023 |
| SHA-36 | Wells #5/#6 FRP Building | 2023 |
| SHA-29 | Air-Vac Assemblies | 2024 |
| SHA-32 | Upper Tank New Vent | 2024 |
| SHA-33 | Upper Tank Reader Board | 2024 |
| SHA-35 | Rondelay Tank New Vent | 2025 |
| SHA-34 | Rondelay Tank Overflow | 2025 |
| SHA-37 | Zone 2 BP Sta Increase Pumping Capacity | 2026 |
| SHA-23 | Diamond Pt Rd Loop Closure | 10-20 Years |
| SHA-20 | Discovery Drive Loop Closure | 10-20 Years |
| SHA-21 | Sherwood Street (North) Main Upsize | 10-20 Years |
| SHA-13 | Sherwood Street Main Upsize | 10-20 Years |
| SHA-24 | Water Right G2-21007 | 10-20 Years |
| SHA-38 | Increase Storage Capacity | TBD |
Note: The projected improvement schedule shown above is subject to change.